As part of the DiverIMPACTS project, we conducted a survey on various crop diversification experiences across Europe. DiverIMPACTS partners from each partner country and from other European projects participated and filled in the online survey form. The participation was a success with more than 120 experiences recorded.
The survey responses were analysed and reported at two international conferences: a poster was presented at the 16th Congress of the European Society for Agronomy in Geneva, Switzerland, and a presentation was given at the 6th International Conference on Organic Agriculture Sciences in Eisenstadt, Austria. The Italian DiverIMPACTS partners (CREA, FIRAB) also published an article with early results based on a sample of Italian experiences.
Given the quantity of variables in the data sets and their interest for both DiverIMPACTS partners and other stakeholders, we decided to carry on this work with the development of a user-friendly, web-based application.
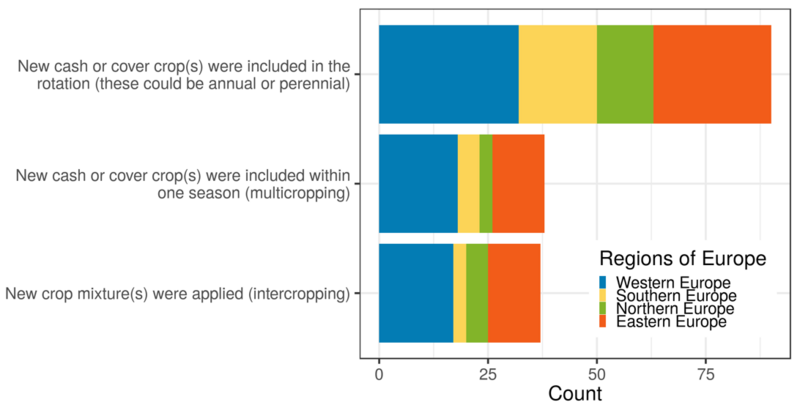
Our ‘survey visualizer’ is a simple but powerful tool that can be used to plot the results of the interview questions and colour graphs according to categorical factors, i.e. other questions or main variables (e.g, regions of Europe). It is already working internally (figure 1). We are now evaluating the various ways to share this application with partners and the public, in accordance with the General Data Protection Regulation.
As a next step, qualitative interviews will be conducted to understand the dynamics of the developments of crop diversification experiences, by identifying key drivers, stakeholders, failure factors, etc.
 toccare e scorrere fino al comando Aggiungi alla schermata iniziale.